Sailgene Technology

Integrating Whole-Genome Bisulfite Sequencing and RNA-seq to Better Understand Gene Regulation
Release time:2026-11-09 16:28:53
Integrating Whole-Genome Bisulfite Sequencing and RNA-seq to Better Understand Gene Regulation
Learn how combining whole-genome bisulfite sequencing (WGBS) with RNA-seq helps connect DNA methylation and gene expression, identify candidate genes and pathways, and explore gene regulation.
Key Takeaways
- WGBS maps DNA methylation genome-wide; RNA-seq measures transcript abundance — integrating them links methylation changes to candidate genes and pathways.
- DMRs (regions) and DEGs (genes) measure different units: genomic annotation must bridge them before any overlap analysis.
- Methylation–expression relationships depend on genomic location, cell type, and species — increased methylation does not always mean decreased expression.
- Integration is hypothesis-generating: matched samples, adequate replication, and careful genomic interpretation determine how reliable the candidates are.
From DNA Methylation Changes to Biological Insights
Whole-genome bisulfite sequencing (WGBS) provides a detailed view of DNA methylation across the genome. But finding differentially methylated regions (DMRs) is only the first step. Which changes are linked to gene expression? Which genes and pathways may help explain the biological process being studied?
These questions are especially important when DMRs occur in gene bodies or distant regulatory regions. Such changes may not have a clear link to the nearest gene, so methylation data alone may leave important questions unanswered.
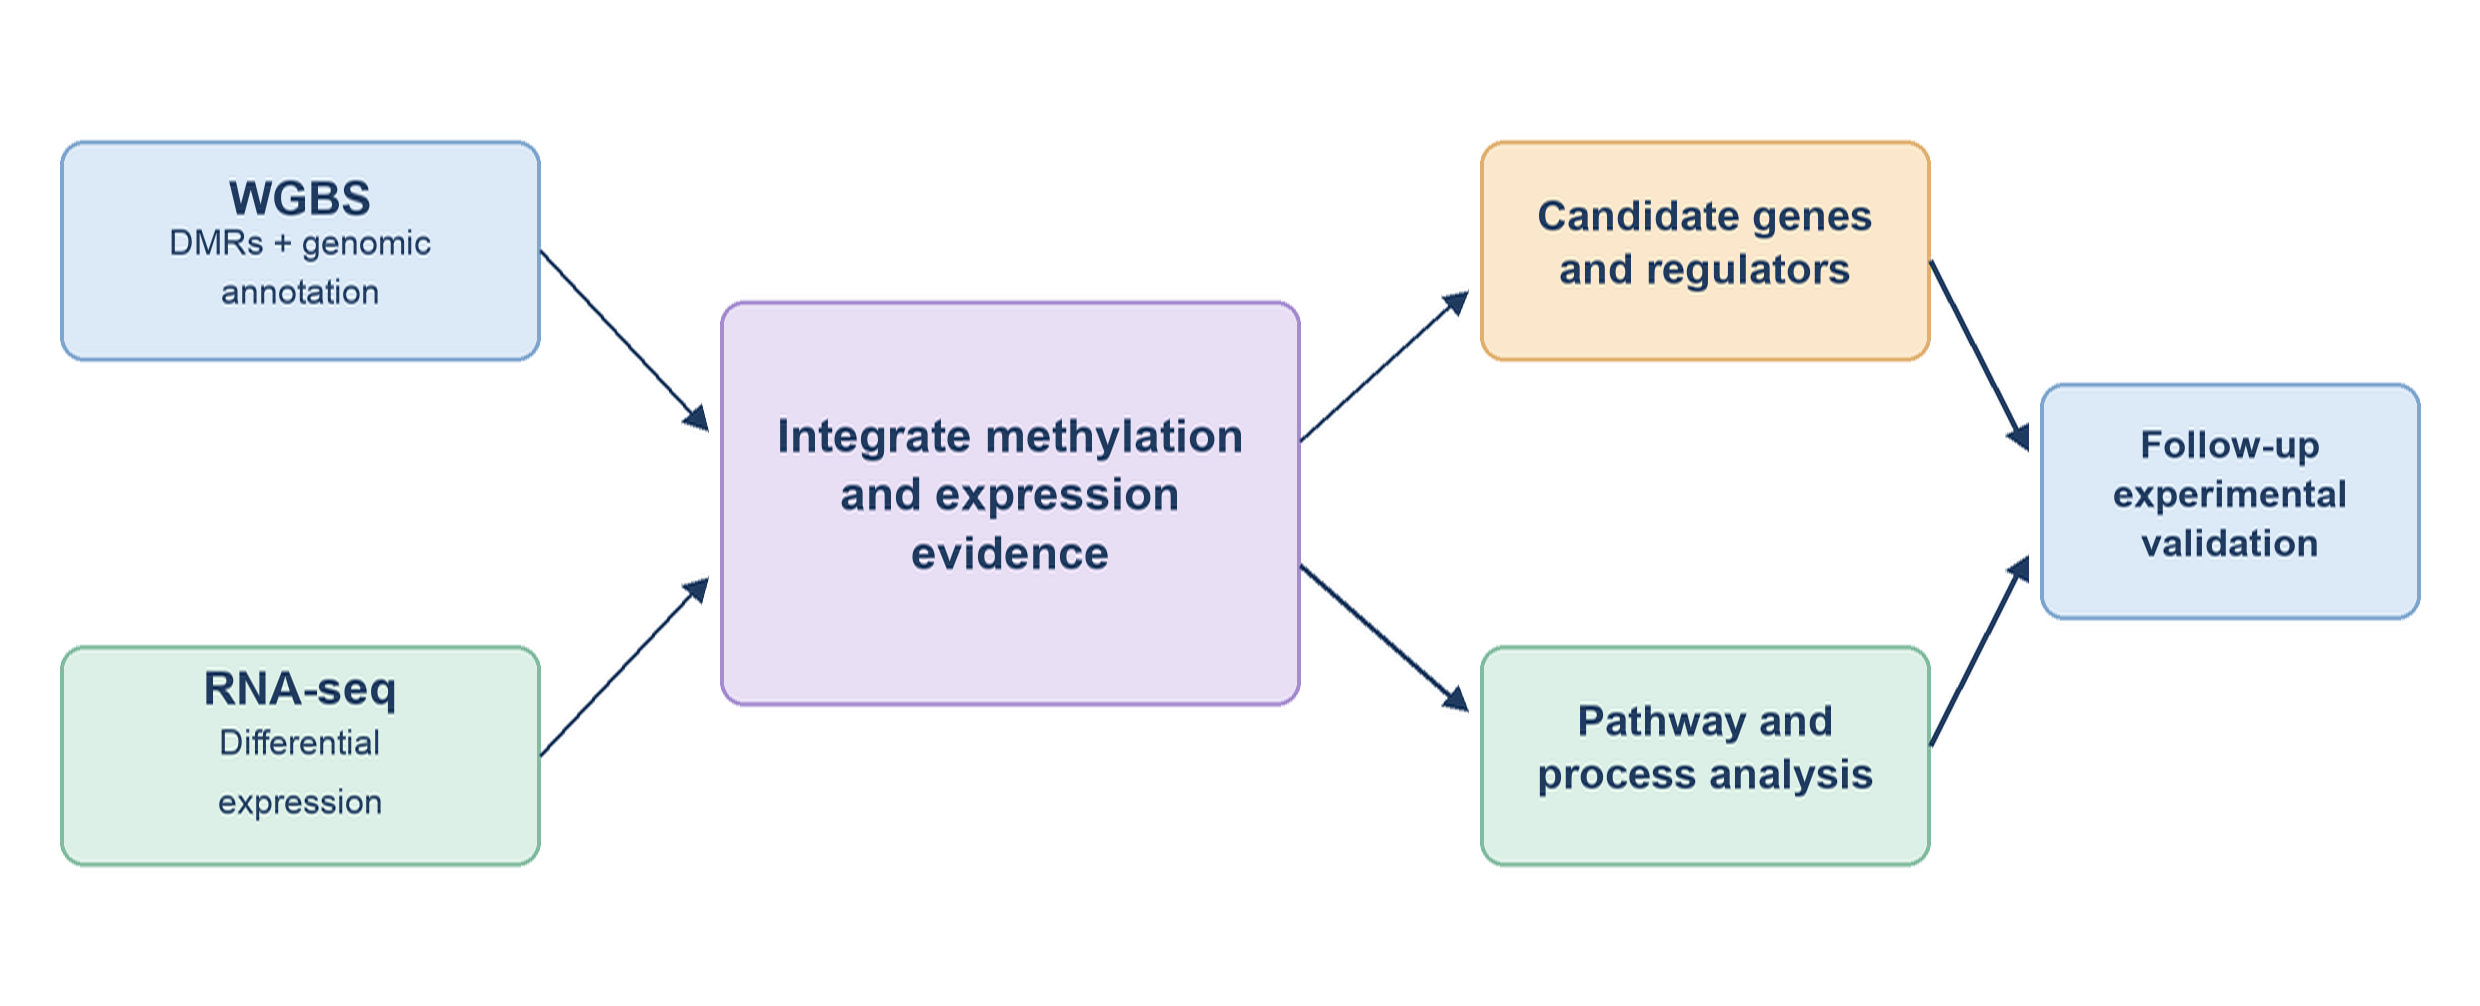
Combining WGBS with RNA sequencing (RNA-seq) helps address this gap. WGBS maps DNA methylation across the genome, while RNA-seq measures transcript abundance and identifies changes in gene expression. Together, these datasets can highlight candidate genes and pathways for further study.
Why the Location of DNA Methylation Matters
Higher methylation at CpG-rich promoters is often associated with lower expression of the corresponding genes, particularly in mammals. However, relationships between DNA methylation and gene expression vary with genomic location, cell type, and species. In plants, DNA methylation also occurs widely in non-CG sequence contexts, while methylation patterns in invertebrates vary considerably among species.
In Atlantic salmon gut tissue, methylation near transcription start sites tended to correlate negatively with gene expression, while regions farther upstream or downstream showed both positive and negative associations. These findings were based on WGBS and RNA-seq data from matched gut tissue samples (Katirtzoglou et al., 2024).
An increase in DNA methylation therefore does not necessarily mean a decrease in gene expression. Genomic context matters, and an observed association does not establish that methylation directly caused a change in gene activity.
Linking DMRs to Changes in Gene Expression
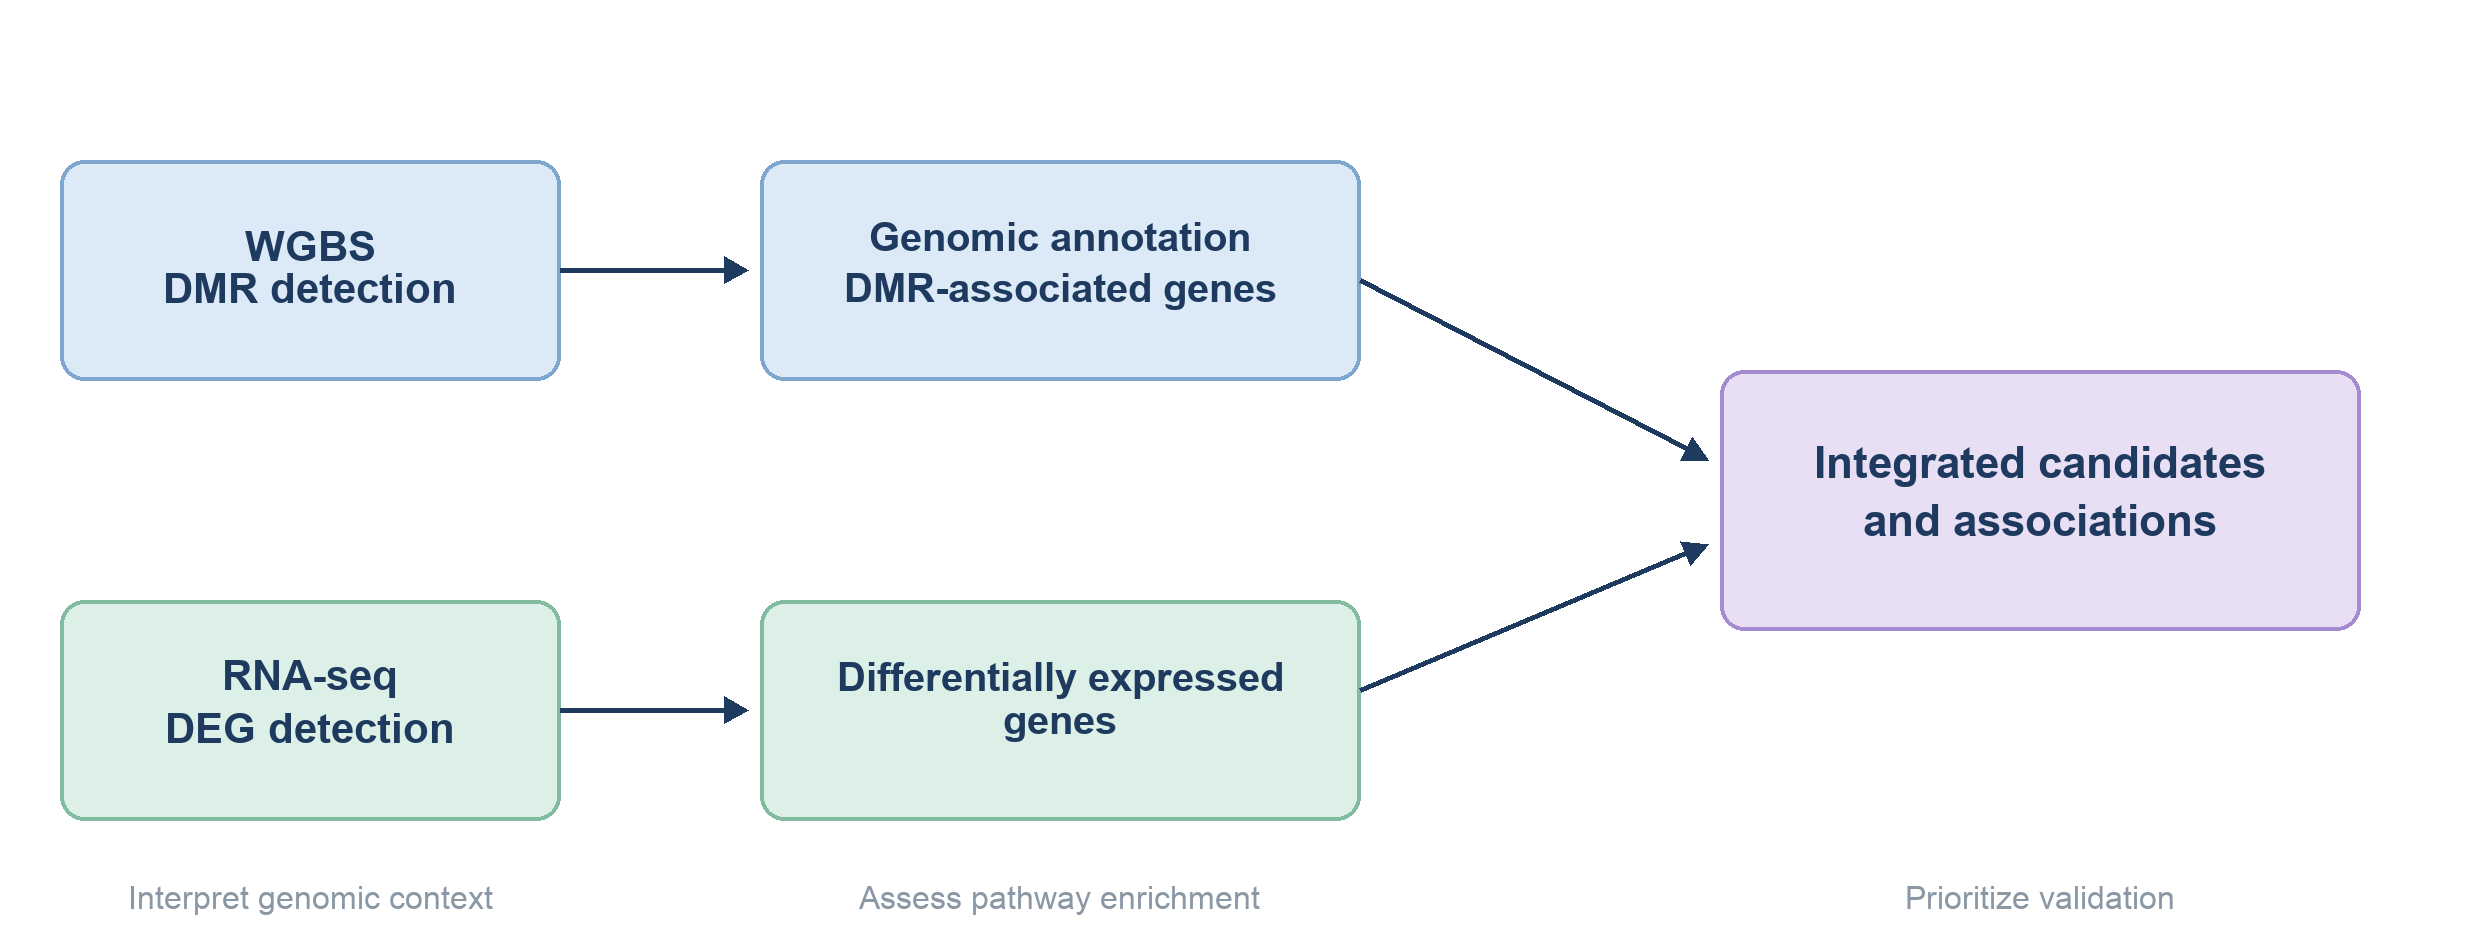
WGBS identifies differentially methylated regions (DMRs), while RNA-seq identifies differentially expressed genes (DEGs). Researchers can annotate DMRs to promoters, gene bodies, and potential distal regulatory elements before assessing their relationships with gene expression. Because a DMR is a genomic region whereas a DEG is a gene with altered transcript abundance, the two cannot be directly intersected without first assigning DMRs to candidate genes or regulatory features. Assigning a DMR to its nearest gene alone may not identify its true regulatory target.
In differentiating bovine skeletal muscle satellite cells (SMSCs) treated with sodium butyrate, WGBS identified 4,292 DMRs. Integrating WGBS with RNA-seq highlighted 130 genes associated with both differential methylation and differential expression, including MDFIC, CREBBP, DMD, LTBP2, and KLF4. Pathway analysis highlighted FoxO, MAPK, PI3K-Akt, and Wnt signaling (Wang et al., 2024).
These results help narrow the focus from a large number of methylation changes to a smaller set of genes and pathways worth studying. However, they do not prove that DNA methylation directly controls these pathways.
Genome-wide methylation profiling can also provide insights into disease biology. For example, WGBS of pancreatic ductal adenocarcinoma (PDAC) organoid models identified methylation signatures associated with cancer stage and molecular subtype, including hypermethylation of genomic regions associated with the GATA6 transcriptional network in the squamous subtype (Wang S. S. et al., 2024). This example primarily illustrates the value of WGBS; complementary transcriptomic data can help investigate the functional relevance of such patterns.
Beyond WGBS and RNA-seq: Additional Regulatory Insights
DNA methylation and gene expression are not the only factors involved in gene regulation. Chromatin accessibility, histone modifications, and transcription factor binding can also affect gene activity.
These factors become especially important when methylation changes occur in regulatory regions far from the genes they may affect. In such cases, additional data may help explain the link.
During mouse lens development, WGBS data were analyzed alongside previously generated RNA-seq and ATAC-seq datasets and other chromatin information. Lower methylation correlated with higher expression of several lens-related genes (Chang et al., 2023). This broader view helped place methylation changes in their regulatory context.
Not every project needs more data types. The best choice depends on what the study aims to explain. WGBS and RNA-seq can help identify links between methylation and expression, while additional methods may help explain how those links work.
Getting More Value from WGBS and RNA-seq Data
The value of integrating WGBS and RNA-seq lies in asking whether methylation and expression changes converge on the same candidate genes or pathways, where they diverge, and how those patterns relate to the research question.
WGBS may identify thousands of DMRs, but only some can be linked to expression changes with the available evidence. Genomic annotation, DMR-associated gene analysis, and RNA-seq results can help prioritize candidates for follow-up investigation.
In oilseed rape (Brassica napus) under drought stress, integrated WGBS and RNA-seq analysis identified 19 core pathways significantly enriched among both DMR-associated genes and DEGs in drought-sensitive and drought-tolerant genotypes. The study also identified 106 high-confidence candidate genes showing negative methylation–expression correlations. These findings suggest potential links between DNA methylation and drought responses, although functional experiments are needed to establish causal regulatory roles (Huang et al., 2026).
At the genome-wide level, methylation and gene expression changes showed only weak overall correlation. Informative gene-level and pathway-level associations can therefore be found even when the two data types are not strongly correlated across the genome.
Sample-level correlation analysis can answer a different question from DMR–DEG overlap between groups. In Atlantic salmon, the large-versus-small fish comparison yielded neither significant DEGs nor significant group-level methylation differences. Nevertheless, the researchers identified 22 significant methylation–expression associations involving 21 genes across samples; the biological meaning of these associations requires further investigation (Katirtzoglou et al., 2024).
These findings distinguish two useful approaches. Group-based differential analyses identify changes associated with an experimental contrast, whereas sample-level correlation analyses test whether methylation levels covary with gene expression. Both approaches require careful genomic interpretation.
Reliable integration also depends on study design. For sample-level methylation–expression correlations, WGBS and RNA-seq should ideally be generated from matched biological samples. Adequate biological replication, sufficient sequencing depth and coverage, control of batch effects, and consideration of differences in cell-type composition are important for interpreting results.
The final step is to examine the findings in their genomic and biological setting. A DMR near a gene does not automatically mean that it controls that gene, and a change in both methylation and expression does not prove a direct effect.
Depending on the question, integrated analysis may include genomic annotation of DMRs, comparisons with DEGs, pathway enrichment, methylation–expression correlations across matched samples, or a combination of these approaches.
Used together, WGBS and RNA-seq can help narrow down candidate genes, reveal pathways worth exploring, and guide follow-up experiments. They can support hypotheses about gene regulation, but cannot establish cause and effect on their own.
Supporting WGBS and RNA-seq Research with Sailgene
Integrating WGBS and RNA-seq provides complementary information about DNA methylation and transcript abundance. Interpreted together, these datasets can support the prioritization of candidate regulatory genes and biological pathways.
At Sailgene, we provide sequencing services for research on epigenetic regulation and gene expression across diverse biological systems. Selecting an appropriate sequencing strategy involves considering sample characteristics, biological replicates, sequencing depth, and downstream research objectives.
Whether your research focuses on cell differentiation, disease mechanisms, or environmental stress responses, high-quality sequencing data provide a foundation for robust biological interpretation.
Contact Sailgene to discuss the sequencing requirements of your WGBS or RNA-seq project.
Frequently Asked Questions
Why combine WGBS with RNA-seq?
WGBS measures DNA methylation, while RNA-seq measures gene expression. Together, they can reveal possible links between the two and help identify genes and pathways worth studying.
Does a methylation change always affect gene expression?
No. The relationship depends on genomic location, cell type, and other factors. Some methylation changes show no clear link to gene expression.
How can DMRs be linked to DEGs?
Researchers can annotate DMRs to genomic features and potential target genes, compare those assignments with DEGs, and incorporate regulatory information where available. With matched biological samples, methylation–expression correlations can provide complementary evidence.
Why are matched samples important when integrating WGBS and RNA-seq?
Matched biological samples make it possible to relate methylation levels to expression measurements within the same samples. This is especially important for sample-level correlation analysis.
References
- Chang, W., Zhao, Y., Rayêe, D., Xie, Q., Suzuki, M., Zheng, D., & Cvekl, A. (2023). Dynamic changes in whole genome DNA methylation, chromatin and gene expression during mouse lens differentiation. Epigenetics & Chromatin, 16, 4. https://doi.org/10.1186/s13072-023-00478-7
- Huang, W., Zhu, W., Zhang, Z., et al. (2026). Integrated epigenomic and transcriptional profiling reveals genotype-specific adaptive reprogramming to drought stress in Brassica napus. BMC Plant Biology, 26, 625. https://doi.org/10.1186/s12870-026-08405-0
- Katirtzoglou, A., Hansen, S. B., Sveier, H., Martin, M. D., Brealey, J. C., & Limborg, M. T. (2024). Genomic context determines the effect of DNA methylation on gene expression in the gut epithelium of Atlantic salmon (Salmo salar). Epigenetics, 19(1), 2392049. https://doi.org/10.1080/15592294.2024.2392049
- Wang, S. S., Hall, M. L., Lee, E., et al. (2024). Whole-genome bisulfite sequencing identifies stage- and subtype-specific DNA methylation signatures in pancreatic cancer. iScience, 27(4), 109414. https://doi.org/10.1016/j.isci.2024.109414
- Wang, X., Zhou, X., Li, C., Qu, C., Shi, Y., Li, C.-J., & Kang, X. (2024). Integrative analysis of whole genome bisulfite and transcriptome sequencing reveals the effect of sodium butyrate on DNA methylation in the differentiation of bovine skeletal muscle satellite cells. Genomics, 116(6), 110959. https://doi.org/10.1016/j.ygeno.2024.110959
Previous Page
Previous Page

Contact Us
If you are interested in our long-read sequencing services or potential collaboration, please contact us. Our team is ready to support your research with tailored solutions. We also welcome feedback from users to help us improve our services.

Contact Us
Add: One Innovation Drive, Suite B3-406, Worcester, MA 01605, USA
在线客服添加返回顶部
右侧在线客服样式 1,2,3 1
图片alt标题设置: SAILGENE TECHNOLOGY INC.
表单验证提示文本: Content cannot be empty!
循环体没有内容时: Sorry,no matching items were found.
CSS / JS 文件放置地